
Measure Value From Day One
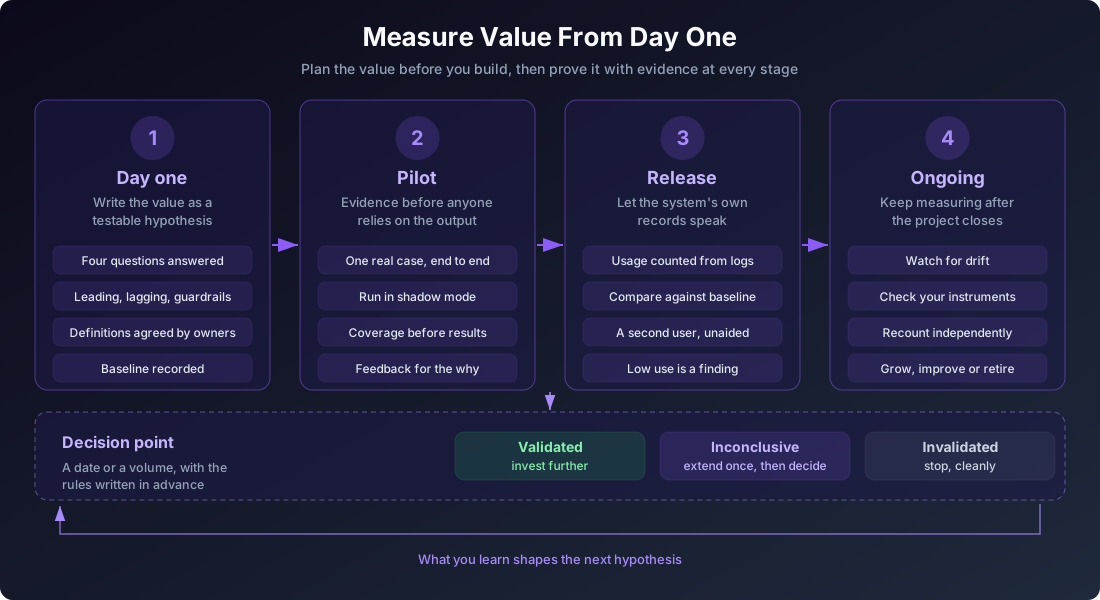
We measure the build in detail, then ask users how they feel once it ships. Write the value as a hypothesis on day one, and prove adoption with evidence through the pilot, the release and beyond.
We Already Know How to Measure
Think about how much we measure while we build software. Every change runs through automated tests. We track coverage, pipeline duration, defect rates, security findings and the time it takes to recover from an incident. A good delivery team can tell you within minutes whether last night’s build is healthy.
Then the software ships, and the measurement often stops. The question becomes “how are people finding it?”, and the answer arrives as feedback: a survey, a few comments in a meeting, a sponsor who says it seems to be going well.
We can bring the same rigour to what happens after release, and we already have the skills to do it. This post is a practical method for measuring the thing that matters most: whether the software is used, and whether it delivers the value it was funded to deliver.
It is for product owners, engineering leaders and sponsors who want to show that an investment worked, with evidence rather than opinion.
Shipping Is Not Succeeding
Most teams have a clear definition of done. The work is reviewed, tested and deployed. That bar matters, but it answers a different question from the one a sponsor eventually asks: did it work?
When done is the only bar, work closes because it was finished, not because its value was shown. Nothing is ever retired for not mattering, because nobody wrote down what mattering would look like.
The fix is to keep two bars. Shipped is one. Succeeded is the other. Keeping them apart means you can ship something and still find out that it did not work, which is exactly how you learn.
Evidence, Not Opinion
Feedback tells you how people feel about a tool. Analysis tells you what they do with it, and often why.
People are generous in feedback, and they are busy. A tool can earn warm reviews and still sit unused, because the old spreadsheet is quicker for the one task that matters. Another can attract complaints and still be the first thing everyone opens in the morning.
Feedback is also good at telling you that something is wrong, and poor at telling you what. I have seen users describe a new assistant as slow. Measurement showed that most of the time went on the assistant discovering its own tools through extra round trips. One configuration change cut the time sharply, with no loss of quality. Feedback said slow. Analysis said where.
The clever bit is that behaviour is measurable, and measuring it is an engineering problem we already know how to solve.
Day One: Write the Value as a Hypothesis
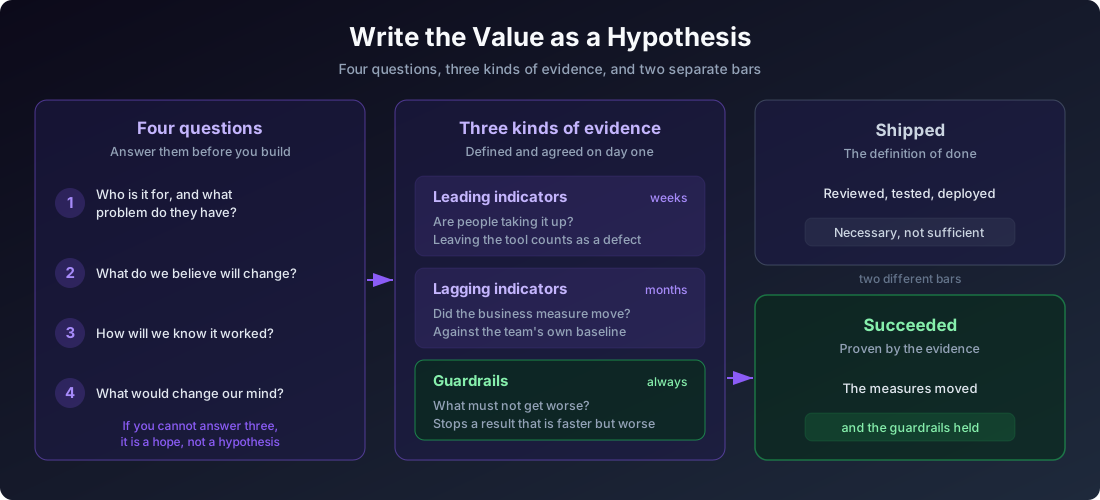
Before anything is built, write down what you expect the work to achieve, in a form you could prove wrong. Four questions get you most of the way:
- Who is this for, and what problem do they have?
- What do we believe will change?
- How will we know whether it worked?
- What would change our mind?
If you cannot answer the third question, you do not have a hypothesis yet. You have a hope.
Then choose the evidence. Three kinds of measure work well together.
Leading indicators show up in weeks and tell you whether people are taking the tool up. How much of the job does the tool complete, and how much does it still ask the user to do? How often does someone leave the tool to finish a task somewhere else? Record each of those as a defect. It is the clearest signal you will get that the tool does not yet fit the work.
Lagging indicators show up in months and tell you whether the business outcome moved. Time per piece of work against the team’s own baseline before the tool. Work that reaches review without needing to be redone.
Guardrails are the things that must not get worse: quality, data integrity, a human approval where one is needed. They stop you celebrating a result that is faster but worse.
Write the definitions before you build any dashboards. For each measure, say exactly what counts, which data it comes from and over which period, and have the people who own the outcome and the people who own the system agree it.
Finally, set a decision point and write down the rules in advance. Pick a date or a volume, and decide now what counts as validated, what counts as invalidated, and what you will do if the result is inconclusive. A sensible rule is to extend once, then decide. Without a date, work quietly carries on until everyone has forgotten why it started.
Record today’s baseline, and build the measurement into the feature the same way you would write its tests. Measurement added after release is always partial, because by then the baseline has gone.
During the Pilot: Gather Evidence Before Anyone Relies on It
Treat the pilot as the smallest real test of the hypothesis: one real case, end to end, rather than a broad demonstration.
Where you can, run the tool in shadow mode first. It works on real input, but its outputs are held back, and it records what it would have done and when. You build a body of evidence about how the tool behaves before a single user depends on it.
Measure coverage before you judge results. Ask how many of the cases the tool should have handled had enough input for it to say anything at all. When a result is missing, the cause is often upstream, in data that was never recorded. Without a coverage measure, that looks like the tool failing. With one, you fix the data feed instead.
Keep the feedback sessions. They explain the why. Let the data tell you the what.
After Release: Let the System’s Own Records Speak
You rarely need a survey to find out who uses a tool. The service already logs its requests. Count actions and visits from those logs, per team or per site, and you have adoption without adding tracking code to the product. Count only what you need, avoid groups small enough to single anyone out, and use a keyed hash of the user identifier when you need unique users. That way you can count people without knowing who they are.
Then compare against the day one baseline. Did the leading indicators hold, did the guardrails stay green, and did the business measure you named actually move?
Look out for one signal in particular: a second person, not the original champion, completing the job without help. Enthusiasts will make almost anything work. When someone who did not ask for the tool uses it unaided, it has been adopted.
And be ready for the data to surprise you. Low use is not a failure of measurement. It is a finding. I have seen lower usage than expected turn the question from “does the tool work?” into “can people actually reach it?”, a question no survey would have thought to ask.
Ongoing: Keep Measuring, and Check Your Instruments
Value is not permanent. Processes change, people find workarounds, and other tools arrive. Keep the same indicators running after the project has closed, and they will tell you when adoption is drifting, when a feature has earned more investment, and when something has stopped earning its keep and can be retired.
Your instruments drift too. A test that still passes may be measuring a version of the product that no longer exists. When the product changes, check that the measurements changed with it.
Make the Numbers Worth Trusting
A figure nobody trusts will not change a decision, so build the trust in.
Count it twice. Compute your headline numbers a second, independent way. It is cheap, and when the two disagree they point straight at a definition or data problem that feedback would never reveal.
Show how far to trust each figure. Mark a number as not yet verified until the second count agrees. Show a range rather than a single value where the sample allows it, and grey out small samples and periods that have not closed.
No target, no colour. A red, amber and green board without agreed targets is a guess presented as a judgement. Keep it neutral until the people who own the outcome have set the targets, then colour by the range: amber while it still reaches the target, red only when all of it falls below.
Measure the outcome, not a substitute for it. A review step that counts comments as resolved will turn green when someone replies “will fix”, whether or not anything was fixed. Count the fix, not the closed comment.
Count the decision, not the volume. If you worry that people will create work simply because a tool makes it easy, do not count the items. Record why each one exists, and you can tell the work that was needed from the work that was optional.
Where Activity Metrics Fit
None of this replaces the numbers teams already use. Test coverage, tickets closed, cycle time and AI token spend are good instruments for running the work well. They tell you about the health of the build and the cost of making it.
They do not tell you whether it succeeded. Keep them where they help, inside the team, and put adoption and measured business value in front of the people who funded the work.
Take SAFe’s Best Idea, Whether You Run It or Not
The Scaled Agile Framework attracts plenty of criticism for the weight of its process, and some teams deliberately choose not to adopt it. That can be the right call for a small team. But there is one idea at its core that every team can take, with or without the ceremonies: treat the work as a testable claim about value.
The first of SAFe’s ten Lean-Agile principles is to take an economic view. The fifth bases milestones on objective evaluation of working systems, so that teams can “ensure that a continuing investment will produce a commensurate return”. The framework even has a name for writing work this way: the epic hypothesis statement.
You do not need increment planning or a release train to answer four questions before you start. And if you do run SAFe, this is the part that makes the rest of it pay off. The planning and the cadence work best when they have real evidence to steer by.
Getting Started
- Write the hypothesis. Answer the four questions before the work starts.
- Name the KPI and record the baseline. One business measure, and its value today.
- Choose leading indicators, lagging indicators and guardrails. Agree the definition of each with both owners.
- Set the decision point. A date or a volume, with the rules written in advance.
- Instrument it with the feature. Treat measurement like tests: part of done, not an afterthought.
- Pilot small, and in shadow mode where you can. Gather evidence before anyone relies on the output.
- Count usage from the logs, anonymously. Skip the survey for the question of who uses it.
- Recount independently, and keep measuring. Trusted numbers change decisions. Check your instruments as the product changes.
Why It Is Worth It
Working this way changes three things. New work gets harder to start, because some ideas will not survive the four questions. Work gets easier to stop, because “the numbers did not move” is a clean, blameless reason. And some work you have already shipped will turn out not to have mattered.
That last one can sound uncomfortable. It is actually the most freeing part. That work exists today whether you measure it or not. Measuring simply lets you see it, and move the investment to the things that do work.
There is also a moment I have seen several times, and it never gets old. A sponsor asks whether the investment worked, and instead of a slide about effort, the team shows the evidence: who uses it, how much time it saves, and the business number it moved. The conversation changes. It stops being about defending the cost of the last project and starts being about where to invest next.
That is what measuring value from day one buys you.

25 years building secure digital solutions for regulated and modern teams.